Download

Debug Analyzer: Bringing back the dead!

date January 29, 2011 04:13 by author Sukesh Ashok Kumar

Debugging memory dumps are also known as Post-mortem debugging and the reason for this is simple. Memory dumps are just a snapshot of the process memory (in case of usermode dumps) and not live at the time of debugging thus the term 'post-mortem'.

While working on Debug Analyzer.NET I was hunting for coolness, things which were never done before and thought it would be ultra-cool to give life to objects in the dumps.
Let me explain! Assume that you have a DateTime field for a class and available in the memory dumps. You would like to do some comparison or manipulation of that object, like we do with live objects.

It would be very useful if we can utilize methods provided by .NET for that type of object to ease manipulation... isn't it?
So here it is, the power to give life to objects from the dumps!!!

Let's see a System.DateTime object in Windbg + SOS

[*** Dump one of the System.DateTime object ***]
0:013> !do 0707e980 
Name: System.DateTime
MethodTable: 0f310010
EEClass: 0f3085d8
Size: 16(0x10) bytes
 (C:\WINDOWS\assembly\GAC_32\mscorlib\2.0.0.0__b77a5c561934e089\mscorlib.dll)
Fields:
      MT    Field   Offset                 Type VT     Attr    Value Name
0f344060  40000f4        4        System.UInt64  1 instance 633988790520830000 dateData


Now give life to the dead object using Debug Analyzer.NET !!!

string someAddress = "0707e980";
// ConvertTo is a generic method which supports a number of different .NET types
DateTime datetime = someAddress.ToClrObject().ConvertTo<System.DateTime>();

// You can also do this since ToClrObject is an Extension method for string type
DateTime datetime = "0707e980".ToClrObject().ConvertTo<System.DateTime>();


Let's see the advantage... the object is alive which means you have all the methods and properties .NET provides for that object type.

System.DateTime ConvertTo

Check method ClrExtMethods.ConvertTo in help for supported types. More support for types coming sooooon...

Note: Please use comments to suggest the types you think would be useful!


Scenario: How to find logged-in users with ASP.NET forms based authentication

date January 21, 2011 03:52 by author Sukesh Ashok Kumar

Lets talk about a scenario here and take a look at manual way to find what we need with windbg + sos.
We will then see how we can automate this using Debug Analyzer.NET Analysis.
For learning pleasure and reuse, attached code snippet can be saved in snippets folder and used with Instant Analyzer feature too.

Scenario
An intranet ASP.NET application becomes very slow during off-peak hours. Since it's during off peak hours we can guess that it might not be due to heavy load.
There are several different tools and ways to troubleshoot this issue using profiling tools etc... But since running profiler etc might not be a great idea on production servers, we will use memory dumps to get the users who are using the application and then check what they are doing during that specific time of the issue.
(Maybe running a slow moving, large report?)

Let us see how this can be done in Windbg + SOS

[*** Dump all the objects of type System.Web.Security.FormsAuthenticationTicket ***]
0:034> !dumpheap -type System.Web.Security.FormsAuthenticationTicket
------------------------------
Heap 0
 Address       MT     Size
10525a48 663b3f14       44     
107f84f4 663b3f14       44     
total 2 objects
------------------------------
Heap 1
 Address       MT     Size
1454e4c0 663b3f14       44     
145c0a00 663b3f14       44     
14a04878 663b3f14       44     
total 3 objects
------------------------------
Heap 2
 Address       MT     Size
184fc27c 663b3f14       44     
total 1 objects
------------------------------
Heap 3
 Address       MT     Size
1c43ca44 663b3f14       44     
1c511cfc 663b3f14       44     
total 2 objects
------------------------------
total 8 objects
Statistics:
      MT    Count    TotalSize Class Name
663b3f14        8          352 System.Web.Security.FormsAuthenticationTicket
Total 8 objects

[*** Let us dump out one of those objects ***]
0:034> !do 107f84f4
Name: System.Web.Security.FormsAuthenticationTicket
MethodTable: 663b3f14
EEClass: 663b3e50
Size: 44(0x2c) bytes
 (C:\WINDOWS\assembly\GAC_32\System.Web\2.0.0.0__b03f5f7f11d50a3a\System.Web.dll)
Fields:
      MT    Field   Offset                 Type VT     Attr    Value Name
79102290  4001e61       10         System.Int32  1 instance        2 _Version
790fd8c4  4001e62        4        System.String  0 instance 107f8520 _Name
7910c878  4001e63       18      System.DateTime  1 instance 107f850c _Expiration
7910c878  4001e64       20      System.DateTime  1 instance 107f8514 _IssueDate
7910be50  4001e65       14       System.Boolean  1 instance        0 _IsPersistent
790fd8c4  4001e66        8        System.String  0 instance 107f853c _UserData
790fd8c4  4001e67        c        System.String  0 instance 107f8550 _CookiePath

[*** Now dumping out the field name called '_Name' ***]
0:034> !do 107f8520 
Name: System.String
MethodTable: 790fd8c4
EEClass: 790fd824
Size: 28(0x1c) bytes
 (C:\WINDOWS\assembly\GAC_32\mscorlib\2.0.0.0__b77a5c561934e089\mscorlib.dll)
String: USER1                                      <=== Heyaa!!! we got the user name!!!
Fields:
      MT    Field   Offset                 Type VT     Attr    Value Name
79102290  4000096        4         System.Int32  1 instance        6 m_arrayLength
79102290  4000097        8         System.Int32  1 instance        5 m_stringLength
790ff328  4000098        c          System.Char  1 instance       55 m_firstChar
790fd8c4  4000099       10        System.String  0   shared   static Empty
    >> Domain:Value  000f0050:790d884c 00114ca8:790d884c <<
7912dd40  400009a       14        System.Char[]  0   shared   static WhitespaceChars
    >> Domain:Value  000f0050:142d03f4 00114ca8:142d456c <<

Repeat the commands in line # 35 and 52 (8 times) for each object from the 1st command result.

Now lets see how this can be done in Debug Analyzer.NET (automation and reuse with 4 lines of code)

// Write a heading
WriteHeadLine("Forms Authentication Users");

//Get all objects of type 'System.Web.Security.FormsAuthenticationTicket'
IEnumerable<ClrObject> objs = Analyzer.CLR.GetClrObjectsByType("System.Web.Security.FormsAuthenticationTicket");

//Enumerate through all Objects of type 'System.Web.Security.FormsAuthenticationTicket'
foreach (ClrObject clrobj in objs)
{
    ClrObject cobj = clrobj.ClrObjectFieldCollection["_Name"].ToClrObject();
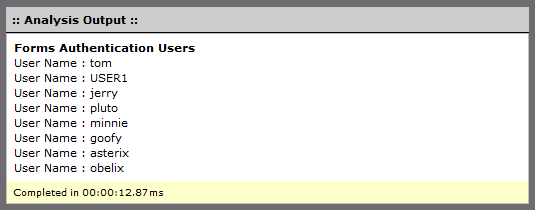
    WriteHtmlLine("User Name : {0}", cobj.ToString());    //Shows the string value using Extension Method
}

See the result below (all Disney characters on your intranet?)

Tip: How many lines of code are needed to show the ClrObject in !do format?

Answer is 1 line of code!!! (write the following line of code, inside the foreach loop).

WriteHTMLLine(clrobj.ToHtml());                     

How cool is that? !!! Cool

(Use right-click and Save Target As...)
Download FormsAuthUsers.cs (850.00 bytes)


How Visualizer works?

date January 21, 2011 01:13 by author Sukesh Ashok Kumar

Often times complex analysis becomes difficult to digest in textual format. That's where power of Visualization shines.
Although the feature is not ready for general use for writing Visualizers, I would like to give you a sneak peek at powerful Visualizer feature part of Debug Analyzer.NET!
(Keep in mind, Visualizer does not always mean graph)

Let us see a screenshot of the Visualizer and then the amount of code required to create this!


Lets see the code required to create the above Visualizer!

// Data Binding code for the Graph - Top 5 items of ClrHeap sorted descending on TotalSize
chartSurface.DataSource = Analyzer.CLR.ClrHeapCollection.OrderByDescending(h => h.TotalSize).Take(5);
chartSurface.DataBind();

// Formatting point labels with friendly values like Bytes/KBytes etc...
foreach (DataPoint p in chartSurface.Series[0].Points)
{
    p.Label = p.YValues[0].ToByteString();    
}

I'm excited about the capabilities Visualization can bring about. Hope to finish the implementation of this feature sooooooon!
See what you can achieve with just 2 lines of code!!! Cool


Video Tutorial

date January 2, 2011 04:13 by author Sukesh Ashok Kumar

Let us see different features in action in 5 min to fame style screencast...!


How Learn Mode Works?

date January 2, 2011 03:13 by author Sukesh Ashok Kumar

One of the core idea behind Debug Analyzer.NET is to aid in learning Debugging and also about the issues it detects.

Learn mode is a way for the analysis results to provide articles or other resource links which would help in understanding the issue better and also get guidance on how to avoid such issues in future.
Let us see how it looks like in a sample report.

The icon  is a clickable link to resource article related to the issue. In this case it's the result of the following code in the analysis plug

WriteRecommendation(ResultSeverity.Error,
        "You have hit a performance bottle-neck related to Throttling [LM60001] " +
        (capacity == 16 ? " (due to very low default value on .NET 3.0)" : ""),
        "Please change the values of maxConcurrentCalls as per suggestion");


What are the different formats for Learn Mode articles ?

Learn Mode Articles - [LM<learnId>] eg. [LM50000] 
Microsoft KB - [KB<articleId>] eg. [KB123456] 
Microsoft Bulletins - [<bulletinId>] eg. [MS10-049]


How to get the list of Learn Mode Articles?

http://go.debuganalyzer.net


How Interactive Debugging Works?

date January 2, 2011 02:13 by author Sukesh Ashok Kumar

Interactive Debugging feature provides a way for you to manually debug the memory dumps like you do normally. It also provides a way to save the output in RTF format so that you can use it for reference later.

The main benefit of Interactive Debugging is that it enables you to create .NET based commands, equivalent to Debugger Extension commands called 'Command Plugs'.
This feature is still work-in-progress so currently this feature supports only basic debugger commands.

More features in the pipeline... hold your thoughts!


How Instant Analyzer works?

date January 2, 2011 02:13 by author Sukesh Ashok Kumar

Instant Analyzer is more like SQL Query Analyzer, you write your analysis and hit F5 ("Compile & Execute") and it shows the results in the window below.
You can also save and load snippets, which are saved and kept under the 'snippets' folder. The 2nd icon for loading and 3rd icon for saving.

The following things happen when you hit F5 or "Compile & Execute"

  • Complete Analysis Plug source is generated by merging the source in the Code Editor below
  • The Analysis Plug is compiled (C# for now) to generate an in-memory Analysis Plug (assembly)
  • Plug Framework evaluates the Analysis Plug to get the Attributes
  • In-memory Plug is then instantiated and Invoked by the Debug Analyzer Engine
  • Debug Analyzer Engine invokes the Data Access Component for the relevant Data
  • Uses the Debugger to get the required data from memory dump requested by the Plug
  • Executes the Entry-point function of the Plug and generates the HTML report content
  • Debug Analyzer Engine gives back the HTML report content
  • Report window at the bottom, shows the HTML report content

Below screenshot shows powerful reporting capability with Graph to display Top 5 .NET Heaps details.


Below screenshot shows powerful Analysis capabilities using .NET Lambda expression syntax

The above snippets are already included in the download.

VB.NET support and 'Compile and Publish' option coming soon...
'Compile and Publish' option would allow you to convert snippet into Analysis Plug directly with the click of a button.


Hello World Analysis Plug

date January 2, 2011 01:31 by author Sukesh Ashok Kumar

A lot of work was done to keep simplicity and zero learning curve for writing Analysis Plugs. Steps to create a Hello World Plug mentioned below

  • Using Visual Studio or Visual Studio Express create a 'Class Library' project
  • Add reference to Debug.Analyzer.API
  • Inherit the Class from AnalysisPlug
  • Override the method called RunAnalysis()
  • Build the DLL and copy to 'Analysis' folder
  • Add to any Analysis Template!
// *** Hello World Analysis Plug *** //
using DebugAnalyzer.ObjectModel;

namespace Analysis.Sample
{
    public class SamplePlug : AnalysisPlug
    {
        public override void RunAnalysis()
        {
            // Begin Report and specify Title for Report Island
            BeginReport("Hello World!");

            // Normal report line using fixed width font
            WriteDataLine("This is in Fixed width Font!");

            // Add blank line in the report
            WriteBlankLine();

            // Add Bold line for headings
            WriteHeadLine("Drawing Graph has become easy as well...");

            // Add Graph with color, percentage and label
            WriteGraphLine(GraphColors.LightGreen, 70, "System.String - 70%");
            WriteGraphLine(GraphColors.Orange, 50, "System.Byte[] - 50%");

            // Adding HTML content in the report
            WriteHtmlLine("Testing for HTML content inline like <b>bold</b> <i>italics</i> <u>underline</u> words");

            // Write Recommendation
            WriteRecommendation(ResultSeverity.Error,
                                "Here goes the description for the issue...",
                                "Here goes the recommendation for fixing the issue...");
            
            EndReport();
        }
    }
}

This is a sample plug to show the different reporting functions available. Keep in mind no analysis is done in this Plug!


Above screenshot shows how the Report looks like for the above Analysis code.
Every Analysis Plug has it's own analysis container called 'Report Island'.


How to change Author Name in the Analysis Plug 'Report Island' to get credit for your own Analysis Plug?

Author Information comes from Analysis Plug's assembly attribute called 'Company'. You can get to this from Project properties (see screenshots below)


Above screenshot shows Project properties


Above screenshot shows Assembly Information window and where you can set Author details.


Frequently Asked Questions!

date January 1, 2011 03:13 by author Sukesh Ashok Kumar

I have addressed few questions below, but if you have any other questions or concerns, feel free to ask through comments.

Q. If I throw a Kitchen sink at Debug Analyzer.NET, will it analyze it for me?

Kitchen sink is not supported at this time.

Q. Can we use Debug Analyzer.NET to do live debug?

Debug Analyzer.NET is a memory dump analysis tool and does not support Live debugging. It's a non-technical decision since you already have tools like Visual Studio, Windbg etc available for that.

Q. Can we use Debug Analyzer.NET for debugging native memory dumps?

Current version of Debug Analyzer.NET supports analysis for .NET and few related commands from native world under Analyzer.DBG. Support for Native scenarios will be provided as and when required. This would be more to help the managed debugging rather than full fledged native support for now.

Q. What versions of CLR are supported by Debug Analyzer.NET?

Current version of Debug Analyzer.NET supports analysis for CLR v2 (and 3.x). CLR v4 support is coming soon after the initial release. Silverlight support is also planned.

Q. Will Debug Analyser.NET support CLR 1.x memory dumps?

There are no plans to support .NET 1.x since its usage is very low and not worth my personal time.

Q. If I write Analysis Plug, how do I get credit for the usage?

Analysis Reporting Framework uses Plug 'Assembly Attribute' called 'Company' to show Author name in the Plug footer. You can add your name or website to show up as Author there (no HTML).

Q. Why is Debug Analyzer.NET current release numbered as V2?

There was a V1 version of Debug Analyzer.NET which was released to showcase the idea of how analysis can be done using Plug Framework. Current version is improved with a redesign of the architecture, implementing a Provider Model and Data Access Components. Also several features were added, one of them being Instant Analysis.

Q. After completion of Debug Analyzer.NET v2, then what?

I have a complete roadmap prepared for v3 and would love to continue working on it. I will be publishing the roadmap sometime in the future.

Q. Does Debug Analyzer.NET contain bugs?

You bet, it would have bugs since it's built by human (yours truly). I have also provided Diagnostic Tracing, configured through config file to get more information about the bugs, as and when it happens.

Q. What is the easy way to learn to write Analysis Plugs?

I'll be blogging more about analysis with samples as snippets which you can use from Instant Analyzer. Also all the built-in Analysis Plugs source would be shared through Codeplex project for your learning pleasure. Since the flow of the Analysis is same as what we do manually, you can learn debugging in Windbg with sos/psscor if you know how to write Analysis and vice versa.


How Application Update works?

date January 1, 2011 02:13 by author Sukesh Ashok Kumar

Let's see step-by-step how the Application Update works with screenshots. Keep in mind at this time you need to manually trigger the update process.
And this would be the case during the Beta timeframe.


Use Help > Check for Updates... option


Notify about the newer version availability


Downloading the Updates


Updates downloaded and ready to be applied.


Updates installed and ready to launch the newer version


Verify the Version number from Help > About