One of the core features of Debug Analyzer.NET is to run Analysis on the memory dumps and provide a friendly report to show you the details in dumps, issues detected and recommendations for resolving those issues. This is accomplished by using a modular approach using Analysis Plugs. The Analysis Plugs are then grouped into what are called "Analysis Templates" according to the scenarios or issues we are troubleshooting.
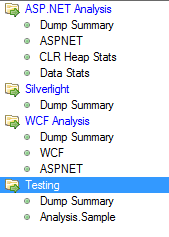
Let us see how the "Analysis Templates" are shown on the left side of the main screen.

How do you Run Analysis?
So when you want to run analysis, you need to select a memory dump and select one of these "Analysis Templates" and click on "Run Analysis".
Each sub element shown under the Template Name (highlighted in blue) are individual Analysis Plugs.
Please see the article titled "Hello World Analysis Plug" on the right for learning to write your Analysis Plugs.
How do you create Analysis Template?
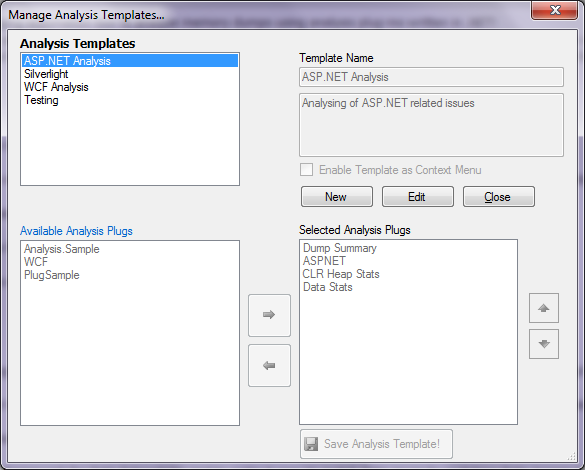
From the top menu click Tools > Analysis Templates. You can get the following screen where you can edit your Templates.
